Every time you push code, and it appears in production 10 minutes later, tested, scanned, deployed, and running, that’s a DevOps pipeline doing its job.
Shipping software used to mean weeks of manual builds, handoff emails, and late-night deployment calls. One missed step and production was down. DevOps pipelines changed that completely.
A well-built pipeline automates everything from the moment you commit code to the moment users see the result. It tests, checks security, builds containers, deploys to cloud infrastructure, and monitors the outcome without human intervention at each step.
This guide explains exactly how that works, from fundamentals to real implementation examples for developers, DevOps engineers, SaaS founders, and cloud architects.
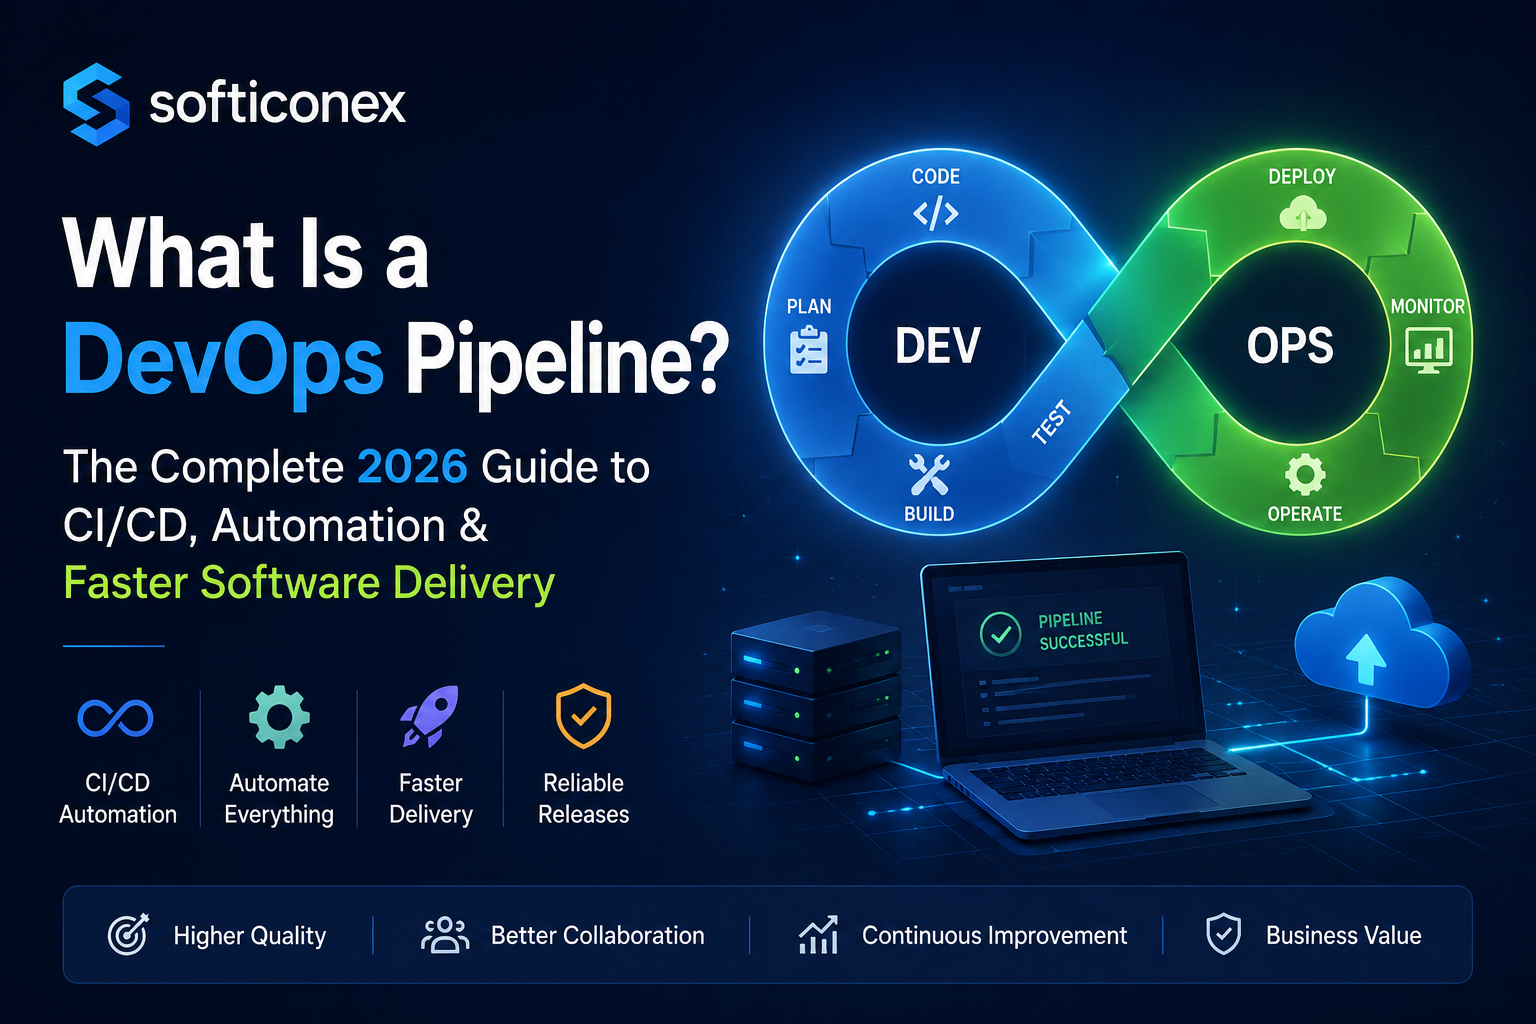
What Is a DevOps Pipeline?
A DevOps pipeline is an automated sequence of processes that takes code from a developer’s machine to production. It enforces consistency, quality, and speed at every stage: build, test, security, deploy, and monitor without requiring manual handoffs between teams.
Think of it like an assembly line in manufacturing. Raw materials (your code) enter at one end. At each station, something specific happens: a check, a transformation, a validation. What comes out the other end is a finished, tested, verified product ready for users.
The key difference from traditional deployment is automation and feedback speed. Instead of a QA team manually testing for two days, the pipeline runs hundreds of automated tests in minutes. Security scanning runs on every commit, not just before release.
DevOps vs. CI/CD: Understanding the Relationship
DevOps is a culture and methodology breaking silos between development and operations teams to ship faster and more reliably.
CI/CD (Continuous Integration / Continuous Delivery or Deployment) is the technical implementation of that philosophy. The pipeline is the mechanism that makes CI/CD real.
Why DevOps Pipelines Matter
The business case for automated pipelines isn’t just about developer convenience; it directly affects revenue, reliability, and competitive advantage.
Faster Time to Market
Manual release cycles that took two weeks can be compressed to hours or minutes. Teams that deploy frequently respond to user feedback faster, fix bugs before they escalate, and ship features competitors haven’t thought of yet.
Drastically Reduced Human Error
Humans make mistakes under pressure. A pipeline running the same steps in the same order every time doesn’t. Automated testing catches regressions before they reach users. Automated deployment eliminates “it worked on my machine” situations.
Stronger Team Collaboration
When the pipeline enforces shared standards, code quality rules, test coverage thresholds, and security policies, everyone operates from the same baseline. Developers, QA engineers, and operations teams stop arguing about processes and start shipping together.
Faster Recovery When Things Go Wrong
With a proper pipeline, rollbacks are a one-click operation, not a multi-hour emergency. When you know exactly what changed and can redeploy the previous artifact instantly, the mean time to recovery drops significantly.
How a DevOps Pipeline Works
At its core, a pipeline is triggered by a code event, usually a commit or pull request, and then executes automated stages in sequence (or in parallel where possible).
Here is the basic flow every pipeline follows:
- Developer commits code
- Source control detects the change
- Pipeline triggers automatically
- Code is built/compiled
- Automated tests run (unit, integration)
- Security and quality scans execute
- Artifact is packaged (Docker image, binary, etc.)
- Deployed to the staging environment
- Acceptance/smoke tests run
- Deployed to production
- Monitoring and alerting begin
- Feedback returned to the development team
Each stage acts as a quality gate. If a stage fails, the pipeline stops, and the team is notified. Code that doesn’t meet the standard never reaches production.
DevOps Pipeline Stages Explained
Most mature pipelines organize work into eight core stages. Here’s what each one does and why it matters.
Plan
Before code is written, work is scoped in project management tools (Jira, Linear, GitHub Issues). Connecting tickets to commits enables traceability, so you can trace any deployment back to a specific business requirement.
Code
Developers write code locally, following conventions enforced by the pipeline: branch protection rules, pre-commit hooks (linting, formatting), and pull request templates. The pipeline starts here; standards are enforced even before a commit hits the remote.
Build
The build stage compiles source code, resolves dependencies, and produces an artifact. For a Node.js app: npm install && npm run build. For a Java service: mvn package. For a containerized app: docker build. The output is a versioned, reproducible artifact, usually a Docker image tagged with the commit SHA.
Test
This is where automated quality gates live. Tests typically run in layers:
- Unit tests: test individual functions in isolation (fast, run on every commit)
- Integration tests: test how components interact (slower, run on PRs)
- End-to-end tests: simulate real user journeys (slowest, run pre-deployment)
- Performance tests: validate latency and throughput under load
Parallel test execution is critical here. Running all test suites sequentially kills pipeline speed. Most modern CI tools support matrix builds and parallel job execution.
Security Scan (Shift-Left Security)
Security scanning used to happen after development was ‘done.’ In modern pipelines, it’s embedded directly; this is the shift-left approach. Common checks include SAST (Static Application Security Testing), SCA (Software composition analysis), container scanning, and secrets detection.
Release
The tested, scanned artifact is versioned and stored in an artifact registry (Docker Hub, AWS ECR, GitHub Packages). Release notes may be generated automatically from commit messages. This stage produces the ‘golden artifact’ that will be deployed.
Deploy
Deployment pushes the artifact to the infrastructure. Strategies vary by risk tolerance:
- Blue-green deployment: Run two identical environments, switch traffic atomically
- Canary deployment: Route a small percentage of traffic to the new version, monitor, then roll out gradually
- Rolling deployment: Replace instances one at a time to maintain availability
- Feature flags: Deploy code to production but keep features disabled until ready
Monitor & Feedback
The pipeline doesn’t end at deployment. Observability tools track error rates, latency, CPU/memory, and business metrics. Alerts fire when anomalies are detected. Feedback loops automatically create issues when monitors fire, closing the loop back to the planning stage.
DevOps Pipeline Architecture
Microservices Architecture
Each microservice has its own pipeline and deploys independently. A change to the payment service doesn’t require redeploying the authentication service. This independent releasability is core to microservices’ value.
Cloud-Native Pipeline Architecture
In Kubernetes-native environments, the pipeline manages infrastructure as well as application code. The typical flow:
- Code Push → CI Pipeline (build, test, scan)
- Artifact pushed to container registry (Docker image)
- GitOps controller (ArgoCD / Flux) detects a new image
- Kubernetes cluster updated via rolling deployment
- Prometheus / Grafana capture deployment metrics
This architecture treats the Git repository as the single source of truth for both application code and infrastructure state in the GitOps model.
Continuous Integration, Delivery, and Deployment: What’s the Difference?
| Term | What It Means | Human Gate? |
|---|---|---|
| Continuous Integration (CI) | Every commit is built and tested automatically | No CI is fully automated |
| Continuous Delivery (CD) | Code is always in a deployable state; deployment requires one button click | Yes a human approves production deployment |
| Continuous Deployment (CD) | Successful builds deploy to production automatically | No fully automated end-to-end |
Most teams operate somewhere between Continuous Delivery and Continuous Deployment. Fully automated production deployments require high confidence in test coverage and monitoring, and they’re not appropriate for every context.
A Real DevOps Pipeline Example
Here’s a production-realistic pipeline for a containerized Node.js API deployed to Kubernetes on AWS.
The Stack
- Source control: GitHub
- CI/CD platform: GitHub Actions
- Containerization: Docker
- Registry: Amazon ECR
- Orchestration: Kubernetes (Amazon EKS)
- Infrastructure as Code: Terraform
- Monitoring: Datadog
Developer Workflow
Developer creates a feature branch: feature/add-user-auth
Opens a pull request to main
Pipeline triggers automatically on PR creation
PR Pipeline GitHub Actions YAML And Production Deployment
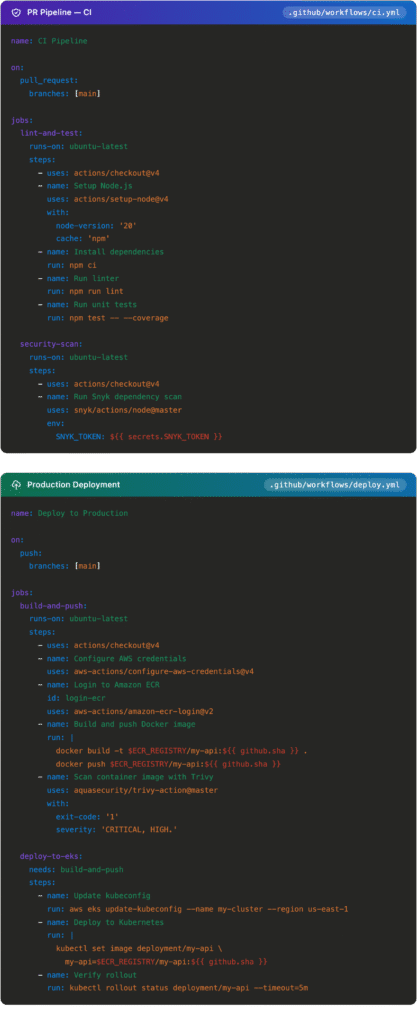
Pipeline as Code
Pipeline as code means your CI/CD workflow is defined in a version-controlled YAML file that lives alongside your application code. This is now standard practice.
Why It Matters
- Pipeline changes go through the same review process as code changes
- Full history of pipeline evolution tracked in Git
- Reproducible environments, the pipeline is always in sync with the code it builds
- Infrastructure and application pipelines can share the same repository
YAML Pipelines Across Tools
| Tool | Config File | Key Concept |
|---|---|---|
| GitHub Actions | .github/workflows/*.yml | Jobs and steps triggered by events |
| GitLab CI/CD | .gitlab-ci.yml | Stages and jobs in a DAG |
| Jenkins | Jenkinsfile | Declarative or scripted pipeline DSL (Groovy) |
| CircleCI | .circleci/config.yml | Orbs (reusable pipeline packages) |
| Azure DevOps | azure-pipelines.yml | Stages, jobs, and tasks |
DevSecOps: Security Embedded in Every Stage
Security is not a phase that happens after development; it’s embedded throughout the pipeline. This shift-left approach catches vulnerabilities when they’re cheapest to fix: during development, not during an audit after deployment.
Security at Each Pipeline Stage
| Stage | Security Check | Tools |
|---|---|---|
| Commit time | Secret detection, secure linting | gitleaks, git-secrets |
| Build time | SAST — source code scanning | SonarQube, Semgrep, Checkmarx |
| Build time | SCA — dependency CVE scanning | Snyk, OWASP Dependency-Check |
| Test time | DAST — live environment testing | OWASP ZAP, Burp Suite |
| Container packaging | Image vulnerability scanning | Trivy, Grype, Clair |
| Deployment | Kubernetes policy enforcement | OPA Gatekeeper, Kyverno |
| Runtime | Secrets injection (never in code) | HashiCorp Vault, AWS Secrets Manager |
DevOps Pipeline Tools: Comparison
| Tool | Best For | Ease of Use | Cloud-Native | Pricing |
|---|---|---|---|---|
| GitHub Actions | GitHub-native teams, open source | Very easy | Strong | Free tier + usage-based |
| GitLab CI/CD | All-in-one DevOps, self-hosted | Moderate | Strong | Free self-hosted; paid SaaS |
| Jenkins | Enterprise, maximum flexibility | Steep | Requires plugins | Open source (hosting costs) |
| CircleCI | Fast parallel CI builds | Easy | Strong | Usage-based |
| Azure DevOps | Microsoft-stack organizations | Moderate | Strong (Azure) | Per-user + usage-based |
For greenfield projects in 2026, GitHub Actions or GitLab CI/CD are the natural starting points. Jenkins remains relevant for large enterprises with existing investment, not as a recommendation for new builds.
DevOps Pipeline Best Practices
Fail Fast, Run Cheap, Checks First
Structure pipelines so the fastest checks run first. Linting and unit tests before integration tests. Integration tests before end-to-end tests. If linting fails, don’t wait to discover security scans also fail; stop early and report.
Deploy Small, Deploy Often
Large deployments are risky: more changes, more potential failure points, and harder debugging. Smaller, more frequent deployments reduce blast radius and make rollbacks trivial.
Build Once, Promote Everywhere
Build the artifact once and promote it through environments. The Docker image that passed your staging tests is the exact image that goes to production. Rebuilding for each environment introduces subtle differences that cause incidents.
Infrastructure as Code for Every Environment
Every environment, development, staging, and production should be defined in code and provisioned by the pipeline. This eliminates environment drift: the problem where production ‘just works differently’ because someone made a manual change months ago.
Implement Rollback Before You Need It
Every deployment plan needs a rollback plan. Keep previous artifact versions in your registry. Use Kubernetes rollback (kubectl rollout undo). Implement database migration strategies that support backward compatibility. Test rollback procedures regularly.
Observability Is Not Optional
Deploy with built-in observability from day one: structured logging, distributed tracing, and metrics. Your pipeline should deploy dashboards and alert rules alongside application code, not as an afterthought.
Common DevOps Pipeline Mistakes
Flaky Tests
Tests that sometimes pass and sometimes fail destroy team trust. Teams start ignoring failures (‘it’s probably just flaky’), and genuine regressions sneak through. Quarantine and fix flaky tests aggressively; they’re more dangerous than no tests at all.
No Dependency Caching
Re-downloading npm packages or pip dependencies on every run wastes significant time. Proper caching can cut build times by 40–70%. Most CI tools support dependency caching natively.
Secrets in Code or CI Variables
Using echo $MY_SECRET in a script or committing .env files are cardinal sins. Every secret must live in a dedicated secrets manager, injected at runtime, never stored in the pipeline configuration or baked into images.
Environment Drift
When staging and production aren’t provisioned identically by the same IaC definitions, you create a category of bugs that only appear in production. Preventable with Infrastructure as Code is inexcusable in modern pipelines.
Deployment Without Observability
Shipping code to production without monitoring in place is like launching a rocket without telemetry. You won’t know it’s failing until a user reports it. Deploy monitoring configurations as part of your pipeline.
Pipeline Performance Metrics: The DORA Framework
The DORA (DevOps Research and Assessment) metrics are the industry standard for measuring pipeline health and overall DevOps performance.
| Metric | What It Measures | Elite Benchmark |
|---|---|---|
| Deployment Frequency | How often do you ship to production | Multiple times per day |
| Lead Time for Changes | Time from code commit to production | Less than 1 hour |
| Mean Time to Recovery (MTTR) | How fast do you recover from incidents | Less than 1 hour |
| Change Failure Rate | Percentage of deployments causing incidents | 0–5% |
These four metrics measure both speed AND stability simultaneously. Teams optimizing only for speed tend to increase their change failure rate. Elite teams achieve high scores on all four, and tracking them is only possible with proper pipeline instrumentation.
DevOps Pipeline vs. MLOps Pipeline
As machine learning moves into production, a new pipeline category has emerged. Understanding the distinction and the overlap matters for modern platform teams.
Comparison: DevOps vs MLOps
| Aspect | DevOps Pipeline | MLOps Pipeline |
|---|---|---|
| Artifact | Application code / Docker image | Trained ML model |
| “Build” stage | Compile / package code | Train the model on data |
| “Test” stage | Unit, integration, E2E tests | Accuracy, bias, and drift checks |
| Versioning | Git commits, semantic versions | Model versions + dataset versions |
| Dependencies | Code libraries | Data, feature stores, model weights |
| Monitoring | Error rates, latency, CPU | Model accuracy drift, data distribution shift |
A common pattern: the MLOps pipeline (training, evaluation, registration) outputs a model artifact to a registry. The DevOps pipeline picks up that artifact and deploys it as an API endpoint using the same deployment infrastructure used for application code.
The Future of DevOps Pipelines
AI-Assisted CI/CD
AI is already appearing inside pipelines: automated test generation (Diffblue, CodiumAI), intelligent test selection (running only tests affected by a specific change), anomaly detection in deployment metrics, and AI-assisted code review as a pipeline stage.
Platform Engineering
As pipeline complexity grows, organizations are building internal developer platforms (IDPs) self-service portals where developers can provision environments and trigger deployments without understanding the underlying infrastructure. Backstage, Port, and Cortex are leading this movement.
GitOps at Scale
GitOps using Git as the single source of truth for both application and infrastructure state is becoming the dominant deployment model for Kubernetes. ArgoCD and Flux are the leading controllers. In a GitOps model, the CI pipeline builds and pushes an artifact; the GitOps controller handles deployment automatically.
Kubernetes-Native Pipelines
Tekton and Argo Workflows run pipeline workloads directly on Kubernetes. Every pipeline step is a containerized Kubernetes task, enabling consistent environments and fine-grained resource control; no separate CI servers infrastructure required.
Security Automation at Scale
The next frontier in DevSecOps is policy-as-code: security rules defined in code (OPA Rego, Kyverno YAML) that are automatically enforced at every stage from PR creation to production deployment without manual security reviews for routine changes.
Conclusion
A DevOps pipeline helps businesses automate software development, testing, deployment, and monitoring for faster and more reliable delivery. In 2026, it has become essential for improving collaboration, reducing errors, accelerating releases, and maintaining high-quality applications. Companies that adopt modern DevOps practices gain a competitive advantage through greater efficiency, scalability, and continuous innovation.
FAQS
Q: What is the difference between CI and CD?
Continuous Integration (CI) automatically builds and tests code on every commit. Continuous Delivery ensures code is always in a deployable state with one-click deployment. Continuous Deployment goes further; it automatically ships to production on every successful build, with no human approval required.
Q: What are the stages of a DevOps pipeline?
The core stages are: Plan → Code → Build → Test → Security Scan → Release → Deploy → Monitor. Each stage acts as a quality gate; if it fails, the pipeline stops, and the team is notified before the issue reaches production.
Q: Which DevOps pipeline tool should I choose?
For teams on GitHub, GitHub Actions is the natural choice: minimal setup, tight integration, huge ecosystem. For all-in-one DevOps needs, GitLab CI/CD is compelling. For complex enterprise pipelines with existing investment, Jenkins remains relevant. For Azure-heavy organizations, Azure DevOps.
Q: Is Jenkins still relevant in 2026?
Yes, in specific contexts. Jenkins isn’t the first choice for new projects, but it runs a significant portion of enterprise CI/CD workloads globally. Its plugin ecosystem and flexibility make it hard to replace when deeply embedded. For greenfield projects, GitHub Actions or GitLab CI/CD are generally better starting points.
Q: What is a pipeline as code?
Pipeline as code means your CI/CD workflow is defined in a YAML file that lives in your repository alongside your application code. Pipeline changes go through the same review process as code changes, with full history tracked in Git.
Q: How does GitHub Actions work?
GitHub Actions triggers workflows based on repository events (push, pull request, schedule, etc.). Workflows are defined in YAML files in .github/workflows/. Each workflow contains jobs with steps, individual commands, or pre-built actions from the GitHub Marketplace. Jobs can run in parallel or in sequence.
Q: What is the difference between blue-green and canary deployments?
Blue-green deployment runs two identical production environments and switches all traffic at once simple and easy to roll back. Canary deployment routes a small percentage of traffic to the new version first, monitors for issues, and then gradually rolls out to all users. Canary is lower-risk but more complex to implement.
Q: What DORA metrics should I track?
The four DORA metrics are deployment frequency, lead time for changes, mean time to recovery (MTTR), and change failure rate. Together, they measure both speed and stability. Elite teams deploy multiple times per day with a change failure rate below 5% and recover from incidents in under an hour.
Q: What is DevSecOps?
DevSecOps integrates security practices directly into the DevOps pipeline rather than treating security as a separate phase. Security scanning (SAST, DAST, container scanning, dependency analysis) runs automatically on every commit, catching vulnerabilities during development when they’re cheapest to fix.
Q: Can small teams benefit from DevOps pipelines?
Absolutely. The cost of a broken production deployment is proportionally higher for a small team. A basic pipeline (automated tests, one-click deploy) can be set up in an afternoon with GitHub Actions, and the time saved compounds immediately.