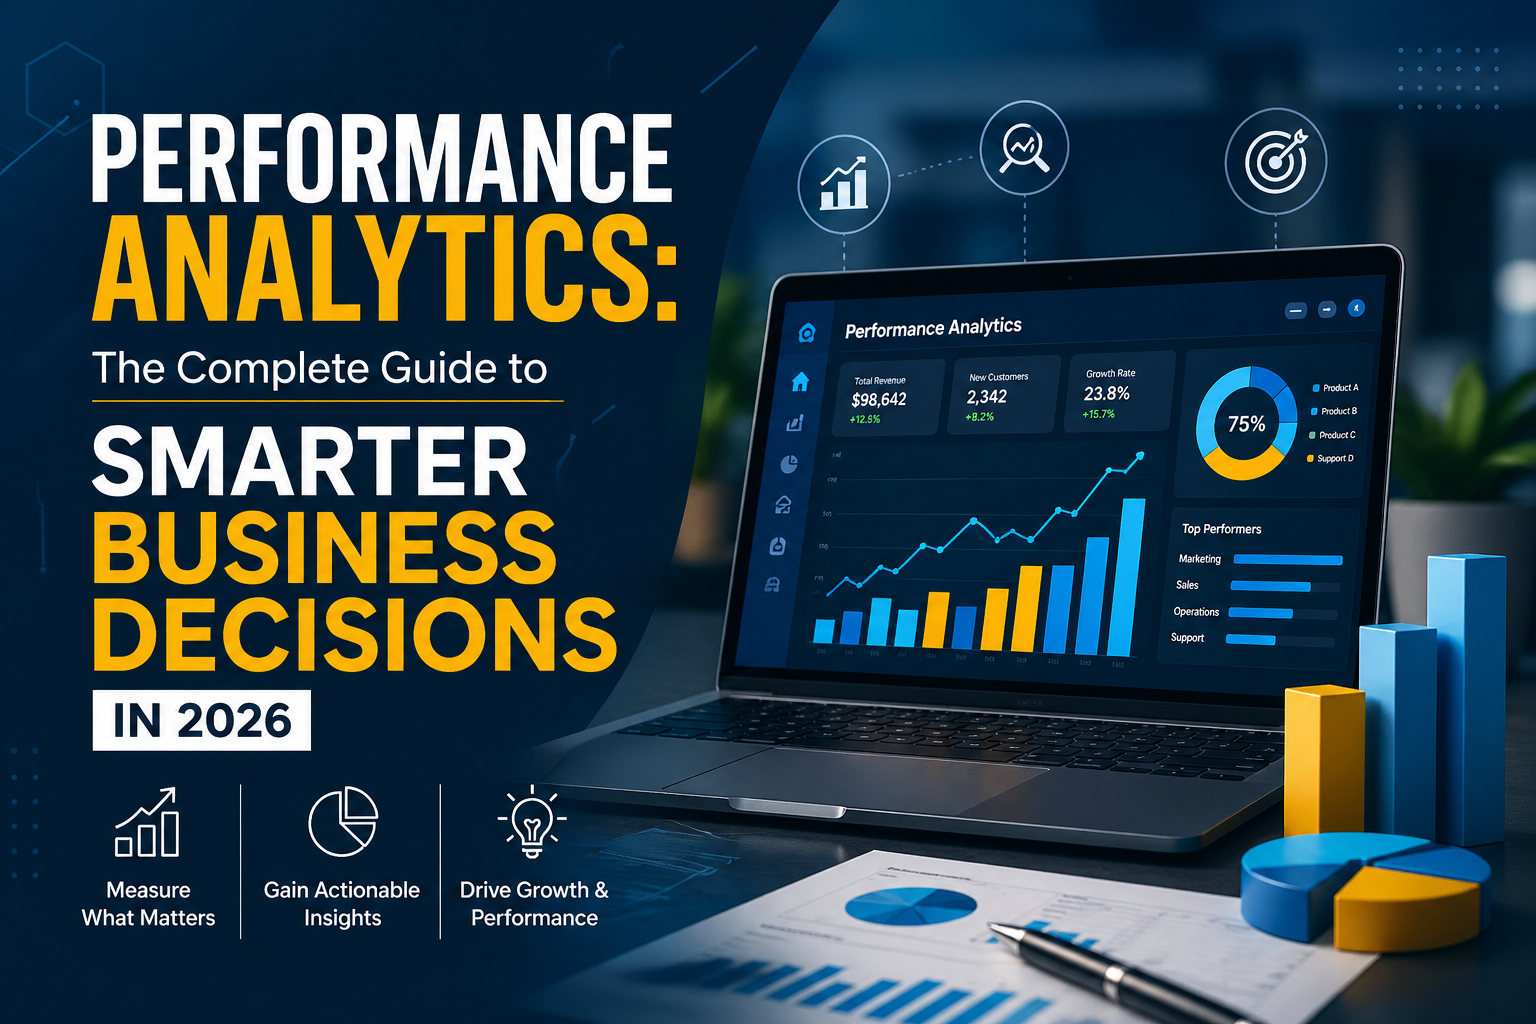
What Is Performance Analytics?
Performance analytics is the systematic practice of collecting, measuring, analyzing, and acting on data related to how well an individual, team, system, or entire organization is achieving its goals. It encompasses the full analytical lifecycle from defining the right KPIs and building measurement frameworks, to visualizing results in dashboards, identifying root causes of performance gaps, and using predictive and prescriptive models to optimize future outcomes.
Unlike basic reporting (which tells you what happened) or traditional business intelligence (which helps you explore historical data), performance analytics is explicitly goal-oriented and action-driven. Its purpose is not just to produce numbers it is to produce better decisions.
The discipline draws from multiple fields: operations research, behavioral economics, data science, and organizational management. But its output is always the same clarity. Clarity about what is working, what is not, why performance is deviating from expectations, and what intervention is most likely to restore or accelerate it.
A mature performance analytics function operates across four dimensions simultaneously:
Measurement: Defining and capturing the right data points across systems, processes, and people, not just any data, but the specific signals that indicate whether strategic objectives are being achieved.
Analysis: Moving beyond raw numbers to understand causation, correlation, and trend. Not “sales dropped 12%” but “sales dropped 12% because our average sales cycle extended by 8 days in the enterprise segment, coinciding with a product pricing change.”
Visualization: Presenting insights in formats that decision-makers can absorb instantly interactive dashboards, exception reports, scorecards, and narrative analytics that compress complexity without sacrificing accuracy.
Action: The step most organizations skip. Genuine performance analytics creates workflows that convert insights directly into decisions automated alerts, workflow triggers, escalation paths, and accountability mechanisms.
Performance analytics is sometimes conflated with business intelligence, reporting, or data analytics generally. These distinctions matter and are addressed in depth in a later section.
Why Performance Analytics Matters More Than Ever
The operating environment of 2026 has fundamentally changed what it means to manage an organization. Several forces have converged to make performance analytics not merely useful but existentially important.
The proliferation of data has created analysis paralysis: The average enterprise now operates across dozens of SaaS platforms, generating terabytes of behavioral and transactional data daily. Having more data does not automatically produce better decisions, it often produces worse ones, as leaders struggle to distinguish signal from noise. Performance analytics provides the framework to make data purposeful rather than paralyzing.
Market cycles have compressed dramatically: In 2010, a company could tolerate a quarterly performance review cadence. In 2026, a six-week lag between a performance problem and its detection can mean lost market share, customer churn, or talent attrition that takes years to recover from. Organizations running real-time performance analytics detect and respond to deviations in hours, not quarters.
Remote and hybrid work has made performance visibility harder to achieve organically: When teams are distributed across geographies and time zones, the informal cues that managers once relied on body language, hallway conversations, and the energy in a room are gone. Performance analytics provides a structured replacement: objective, consistent, and always available.
Board-level and investor scrutiny has increased: Investors, regulators, and board members now expect organizations to demonstrate operational rigor with quantitative evidence. Companies that can walk into a board meeting with a live performance dashboard and a clear causal story about their numbers operate with a credibility advantage that compounds over time.
AI-powered competition has raised the stakes: Your competitors are increasingly using machine learning to optimize pricing, personalization, inventory, and customer acquisition. Organizations that cannot measure their own performance with precision cannot identify where they are losing ground fast enough to respond. Performance analytics is the foundation on which AI-driven optimization must be built, especially when preventing operational decline or potential business closure.
The question is no longer whether your organization needs performance analytics. It is whether you will build it before or after your competitors do.
How Performance Analytics Works: A Step-by-Step Framework
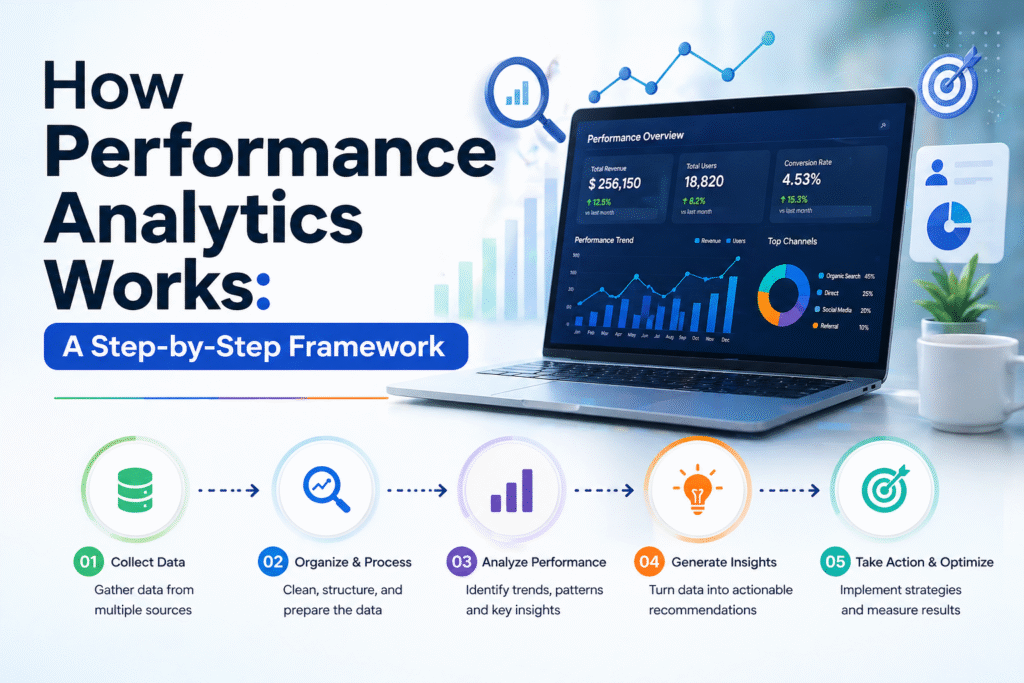
Building a functioning performance analytics capability is not a matter of buying software. It is a process of progressive capability development across five stages.
Stage 1: Strategic Alignment
Before any data is collected, organizations must answer a deceptively simple question: what does good look like? This requires translating high-level strategy into measurable outcomes. If the strategic objective is to grow revenue 30% year-over-year, what are the leading indicators of upstream activities and results that predict whether you will achieve that? Opportunities created, win rates, average deal size, sales cycle velocity, and customer acquisition cost.
Strategic alignment also requires determining measurement ownership. Who is responsible for each metric? At what cadence will it be reviewed? What is the threshold at which a metric triggers an intervention? These governance decisions are as important as the technical infrastructure.
Stage 2: Data Infrastructure
Performance analytics requires clean, connected, real-time data. This means integrating data from across your operational systems CRM, ERP, HRIS, customer support platforms, marketing automation, and financial systems into a centralized or federated data layer. The quality of your analytics output is directly constrained by the quality and completeness of your data inputs.
Modern data stacks typically include a cloud data warehouse (Snowflake, BigQuery, Redshift), an ETL or reverse-ETL layer (Fivetran, dbt, Census), and a semantic layer that ensures consistent metric definitions across the organization.
Stage 3: Metric Framework Design
Not every metric that can be measured should be measured. Effective performance analytics organizations develop tiered metric frameworks: strategic KPIs at the executive level, operational metrics at the functional level, and activity metrics at the individual and team level. These tiers should be causally connected activity metrics should predict operational metrics, which should predict strategic KPIs.
This hierarchical structure, sometimes called a metric tree or KPI tree, ensures that every team member can see how their daily activities connect to organizational outcomes. That visibility is itself a performance driver.
Stage 4: Dashboard and Visualization Development
Once the metric framework exists and the data is flowing, the visualization layer makes it accessible. Effective performance dashboards are not comprehensive; they are curated. A CEO dashboard might show six to eight strategic indicators. A sales manager dashboard shows pipeline coverage, conversion rates by stage, and team quota attainment. A support team dashboard shows ticket volume, resolution time, Customer Satisfaction layer (CSAT), and backlog.
The design of these dashboards matters as much as the data in them. Cognitive load reduction, consistent use of color to signal status (red/yellow/green), clear trend indicators, and drill-down capability for root cause investigation are all design requirements, not nice-to-haves.
Stage 5: Analysis, Insight, and Action Loops
The final stage is where performance analytics earns its keep. Raw dashboards show what is happening. Analysis explains why. Insight generation identifies the highest-leverage intervention. And action loops automated alerts, workflow triggers, regular performance reviews with structured agendas ensure that insights translate into decisions.
Organizations that close this loop consistently from data to decision in hours or days rather than weeks or months build a measurable operational advantage that compounds over time.
Core Components of Performance Analytics
Key Performance Indicators (KPIs)
KPIs are the north star metrics that directly measure progress toward strategic goals. Effective KPIs share several characteristics: they are tied to specific objectives, they are measurable with available data, they are actionable (decisions can be made based on them), and they are owned by a specific individual or team.
The biggest KPI mistake organizations make is selecting too many of them. When everything is a priority, nothing is. Best-practice organizations maintain no more than five to seven KPIs at each organizational level.
Metrics
Metrics are the broader universe of quantitative measurements that support and contextualize KPIs. While KPIs tell you whether you are achieving your goals, supporting metrics tell you why they are the diagnostic instruments of performance management. The ratio of KPIs to supporting metrics is typically 1:5 or higher.
Dashboards
A performance dashboard is a visual interface that aggregates and displays metrics and KPIs in real time or near-real time. Modern dashboards are interactive, allowing users to filter by dimension (region, product, time period, team), drill into root causes, and annotate data points with contextual commentary.
The most effective dashboards are role-specific. The information a chief revenue officer needs differs fundamentally from what a regional sales director needs, which differs from what an account executive needs.
Benchmarks
Benchmarks provide the context that transforms a number from a data point into an insight. Knowing that your customer acquisition cost is $450 tells you nothing unless you know whether that is better or worse than it was last quarter, better or worse than your industry peers, and better or worse than your own target.
Benchmarks can be internal (comparing current performance to historical baselines), competitive (comparing to industry peers using survey data or third-party benchmarking reports), or aspirational (comparing to best-in-class performers regardless of industry).
Forecasting
Performance analytics is not only about the past and present. Forecasting models use historical performance data, statistical algorithms, and increasingly machine learning to project future outcomes under varying conditions. Sales forecasting, demand planning, workforce capacity modeling, and financial projection are all forecasting applications.
The accuracy of forecasts is itself a performance metric. Organizations that track forecast accuracy systematically identify systematic biases (are you consistently over-optimistic?) and improve their models over time.
Trend Analysis
Trend analysis examines how performance metrics move over time, distinguishing genuine directional shifts from random variation. It is the difference between recognizing that a metric has been declining for six consecutive months versus reacting to a single bad week.
Statistical process control methods control charts, moving averages, standard deviation bands provide disciplined frameworks for trend detection that reduce both false alarms and missed signals.
Alerts and Anomaly Detection
Modern performance analytics platforms include configurable alerting systems that notify stakeholders when a metric crosses a defined threshold up or down. Increasingly, AI-powered anomaly detection identifies unusual patterns in data without requiring predetermined thresholds, surfacing issues that human analysts might miss.
Alerts are only valuable when they are actionable. Alert fatigue, the result of too many low-priority notifications is a common failure mode. Effective alert design starts with the question: if this fires, what decision will I make?
Automation
The highest-maturity performance analytics functions automate not just data collection and visualization but response. When a service-level agreement is at risk, the system automatically escalates the ticket. When a sales rep’s pipeline falls below the coverage threshold, a coaching workflow is triggered. When customer health scores drop below a threshold, a customer success manager is notified, and a retention playbook is initiated.
Automation closes the gap between insight and action and it is where performance analytics generates its most direct financial return.
Types of Performance Analytics
Descriptive Analytics
Descriptive analytics answers the question: what happened? It is the foundation layer of any analytics capability aggregating historical data into summaries, reports, and visualizations that describe past performance. Monthly business reviews, quarterly financial summaries, and year-over-year trend reports are all descriptive analytics outputs.
Most organizations are reasonably mature at descriptive analytics. The challenge is that it is the least actionable form by the time you know what happened, the opportunity to influence it has passed.
Diagnostic Analytics
Diagnostic analytics answers: why did it happen? It applies statistical and analytical techniques to historical data to identify the root causes of performance outcomes. Why did churn increase in Q3? Why did the marketing campaign underperform? Why did manufacturing defect rates spike in a specific facility?
Diagnostic analytics requires richer data, more sophisticated analysis, and subject matter expertise to distinguish causation from coincidence.
Predictive Analytics
Predictive analytics answers: what is likely to happen next? It uses machine learning models, statistical algorithms, and historical pattern recognition to generate probabilistic forecasts about future performance. Customer churn prediction, lead scoring, demand forecasting, and predictive maintenance are all predictive analytics applications.
Predictive analytics is where organizations begin to gain genuine foresight and the ability to act before problems materialize rather than after.
Prescriptive Analytics
Prescriptive analytics answers the most valuable question: what should we do about it? It goes beyond predicting outcomes to recommending specific actions that will optimize those outcomes, often across multiple constrained variables simultaneously.
Prescriptive analytics is enabled by optimization algorithms, simulation modeling, and reinforcement learning. A prescriptive model does not just tell you that churn is likely to increase, it recommends which customers to contact first, what intervention to offer, and at what price point, given your available resources and the probability of retention under each scenario.
Real-Time Analytics
Real-time analytics processes and surfaces data as it is generated, with latency measured in seconds rather than hours or days. It is essential in any context where performance deviations require immediate response fraud detection, IT operations, customer service queue management, or live event monitoring.
Real-time analytics requires stream processing infrastructure (Apache Kafka, Google Pub/Sub, Amazon Kinesis) and in-memory analytics engines that can operate on data before it reaches a data warehouse.
Strategic Analytics
Strategic analytics operates at the organizational level, connecting performance data to long-term competitive positioning. It informs decisions about market entry, M&A, product portfolio prioritization, and resource allocation across business units. Strategic analytics typically operates on longer time horizons and higher levels of aggregation than operational analytics.
Operational Analytics
Operational analytics focuses on the day-to-day execution of business processes—the throughput, efficiency, quality, and cost of workflows. It is where performance analytics most directly influences revenue and margin: optimizing supply chains, improving service delivery speed, reducing defect rates, and increasing process automation.
Performance Analytics vs. Business Intelligence vs. Reporting
These three terms are used interchangeably in many organizations, but they represent meaningfully different capabilities with different use cases, infrastructure requirements, and organizational impacts.
| Dimension | Reporting | Business Intelligence | Performance Analytics |
| Primary Question | What happened? | What patterns exist in our data? | Are we achieving our goals, and why? |
| Time Orientation | Historical | Historical + exploratory | Past + present + future |
| User | Operations, finance | Analysts, data teams | Executives, managers, functional teams |
| Output | Static reports | Analytical dashboards | Actionable insights + automated response |
| Goal Alignment | Loose | Moderate | Explicit and central |
| Update Frequency | Scheduled (daily, weekly) | On-demand | Real-time or near-real-time |
| Action Trigger | Manual review | Human analysis | Automated alerts + workflows |
| Predictive Capability | None | Limited | Core feature |
| Business Impact | Low to moderate | Moderate | High |
| Implementation Complexity | Low | Medium | High |
The critical distinction: reporting tells you what occurred. Business intelligence lets you explore and understand your data. Performance analytics is explicitly tied to goals, built around action, and designed to improve outcomes rather than simply describe them.
Many organizations invest heavily in BI tools and discover they still cannot answer the fundamental question of whether the business is performing well, because they have not connected their data to their strategic objectives with the intentionality that performance analytics requires.
Top Benefits of Performance Analytics
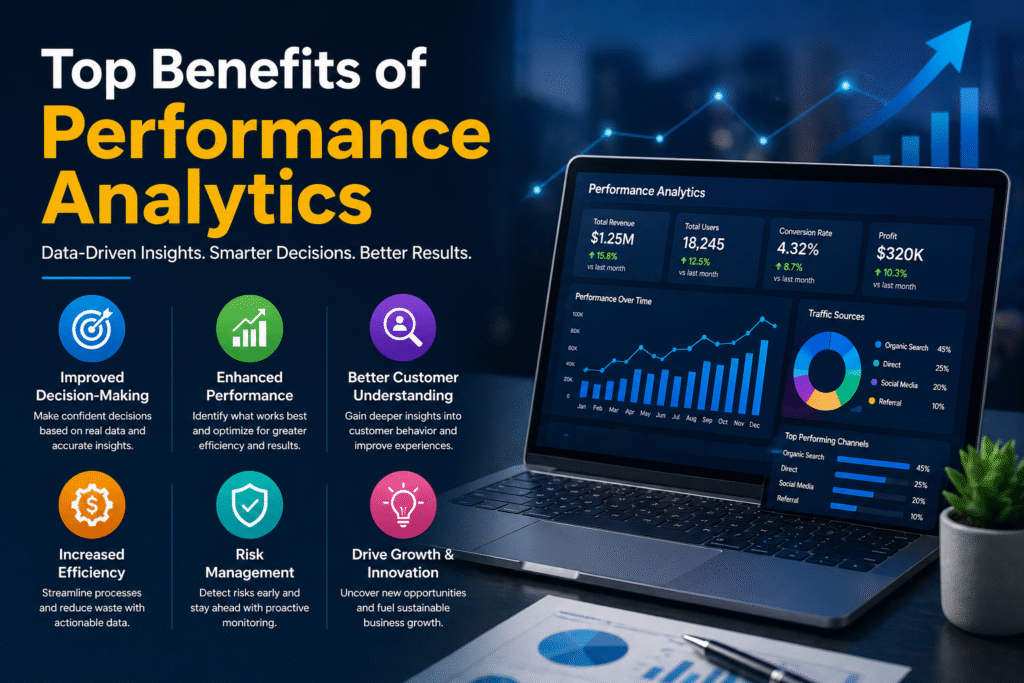
Faster, better-informed decisions: Organizations with mature performance analytics capabilities make significant decisions in hours rather than weeks, because the relevant context is always current and accessible. McKinsey research consistently identifies decision-making speed as one of the primary predictors of organizational performance.
Proactive problem detection: Performance analytics surfaces issues when they are still reversible when a trend is emerging rather than entrenched, when a customer is at risk rather than already churned, when a process is degrading rather than broken.
Accountability without bureaucracy: When performance expectations are explicit, metrics are transparent, and results are visible, accountability becomes structural rather than cultural. Managers do not need to micromanage; the data creates natural accountability.
Resource optimization: Performance analytics identifies where resources are producing disproportionate returns and where they are being wasted. This intelligence drives more effective capital allocation, headcount decisions, and operational investment.
Strategic agility: Organizations that can measure the impact of strategic changes in real time and pivot quickly when a strategy is not working accumulate a compounding competitive advantage. They run more experiments, learn faster, and adapt more effectively.
Improved customer outcomes: Customer-facing performance analytics tracking satisfaction scores, resolution times, churn risk, and product engagement enables proactive service delivery that reduces churn and increases lifetime value.
Talent and workforce optimization: HR performance analytics identifies high performers, predicts attrition risk, optimizes workforce planning, and ensures that performance reviews are grounded in data rather than recency bias and subjective impression.
Real-World Performance Analytics Examples
Sales
A global SaaS company uses performance analytics to track pipeline coverage, stage-by-stage conversion rates, average contract value, and sales cycle length by segment, region, and rep. Predictive models flag deals at risk of slipping based on engagement signals and historical patterns. Sales managers use analytics to prioritize coaching interventions. The result: a 15% improvement in forecast accuracy and an 8% increase in quota attainment within two quarters of deployment.
Marketing
A B2B technology company tracks campaign performance across channels content, paid search, events, and outbound using performance analytics to calculate channel-specific CAC, MQL-to-SQL conversion rates, and revenue attribution by source. The analytics revealed that a particular webinar series was generating 3x more pipeline per dollar than paid search, prompting a budget reallocation that improved marketing-sourced pipeline by 22%.
Human Resources
A professional services firm uses HR performance analytics to track time-to-fill, offer acceptance rates, 90-day retention, manager effectiveness scores, and voluntary attrition by department and tenure band. Predictive attrition modeling identifies employees at elevated flight risk six months before a typical resignation, enabling targeted retention conversations. The firm reduced annualized attrition by 18% within the first year of deployment.
Healthcare
A health system uses performance analytics to monitor ED wait times, inpatient bed utilization, 30-day readmission rates, and patient satisfaction scores across facilities. Real-time dashboards alert nursing supervisors when patient flow metrics approach critical thresholds, enabling proactive staffing adjustments. The system reduced average ED wait times by 23 minutes and improved bed turnover efficiency by 14%.
Finance
A multinational corporation uses financial performance analytics to consolidate actuals, budgets, and forecasts across 47 subsidiaries into a single real-time view. Variance analysis automatically flags budget deviations above defined thresholds, and drill-down capability allows CFO-level investigation without requiring manual reports from regional finance teams. Month-end close time decreased from 12 days to 6 days.
IT Service Management (ITSM)
An enterprise IT organization uses ITSM performance analytics to track incident volume, mean time to resolution, first-call resolution rate, change success rate, and SLA compliance across service tiers. Trend analysis identified a recurring spike in P2 incidents every Monday morning correlated with a weekend batch job, enabling a configuration fix that reduced weekly incident volume by 31%.
Customer Support
A consumer software company uses support performance analytics to monitor ticket deflection rates, CSAT by channel and issue category, agent utilization, and escalation rates. Machine learning models route incoming tickets to the agents most likely to resolve them on first contact, based on historical resolution data. First-contact resolution improved by 19%, and average handling time decreased by 11%.
SaaS Companies
SaaS organizations use performance analytics as a comprehensive operating system, tracking product engagement metrics (DAU/MAU, feature adoption, session frequency), subscription health metrics (NRR, GRR, expansion revenue), and go-to-market metrics (CAC payback, LTV: CAC, pipeline velocity) in an integrated dashboard. The ability to see across product, customer success, and revenue in a single view enables cross-functional alignment that dramatically improves response to churn risk and expansion opportunity.
Best Performance Analytics Tools in 2026
The platform landscape has matured significantly, with clear differentiation emerging across use cases, company size, and analytical sophistication. Below is a comprehensive comparison of leading platforms.
| Platform | Best For | Key Strengths | Limitations | Pricing Model |
| Tableau | Enterprise visualization | Best-in-class charts; strong community | Steep learning curve; BI-first, not PA-native | Per seat; premium |
| Power BI | Microsoft ecosystem | Native M365 integration; cost-effective | Limited outside MS stack; performance at scale | Per user/capacity |
| Looker (Google) | Data teams | Strong semantic layer; LookML flexibility | Requires data engineering resources | Enterprise contract |
| Domo | SMB to mid-market | Ease of use; built-in connectors | Less depth for complex analytics | Per seat |
| ServiceNow PA | ITSM performance | Native ITSM integration; workflow triggers | Limited outside ServiceNow ecosystem | Platform license |
| Workday Prism | HR and finance | Deep Workday data integration | Limited to Workday data without customization | Enterprise |
| Sisense | Embedded analytics | Embed in SaaS products; scalable | Less suited for standalone enterprise BI | Enterprise |
| ThoughtSpot | AI-powered search analytics | Natural language query; auto-insights | Premium pricing; setup complexity | Enterprise |
| Qlik Sense | Associative analysis | Strong for exploratory analysis | UI dated relative to competitors | Per user |
| Klipfolio | SMB KPI dashboards | Rapid deployment; affordable | Limited depth for enterprise use cases | Per seat; SMB |
| Datadog | IT and DevOps performance | Real-time monitoring; infrastructure PA | Narrow use case; not business PA | Usage-based |
| Salesforce Einstein | CRM performance | Native Salesforce data; predictive scoring | Limited outside Salesforce | Platform add-on |
Top Performance Analytics Software Comparison by Use Case
Enterprise Organizations
Large enterprises require platforms that can handle data at scale, integrate with complex technology stacks, enforce governance and access controls, and support multiple concurrent analytical use cases. Tableau, Looker, and Power BI lead in this segment. Enterprises with significant ITSM operations should evaluate ServiceNow Performance Analytics as a purpose-built solution for that function.
Key evaluation criteria: scalability, governance controls, data lineage, enterprise security (SSO, RBAC), and vendor support SLA.
Small and Mid-Size Businesses
SMBs need fast time-to-value, minimal data engineering requirements, and affordable per-seat pricing. Domo, Klipfolio, and Power BI perform well here. Many SMBs start with Google Looker Studio (formerly Data Studio) as a no-cost entry point before graduating to more capable platforms.
SaaS Startups
SaaS companies need platforms that can track product, revenue, and customer success metrics in an integrated view. ChartMogul handles subscription analytics specifically. Amplitude and Mixpanel lead for product analytics. HubSpot consolidates marketing and sales performance. As the company scales, these tools are typically connected via a data warehouse layer using dbt and Looker or Metabase.
IT Teams
IT performance analytics requires real-time monitoring, infrastructure metrics, and ITSM integration. Datadog, Splunk, and ServiceNow Performance Analytics serve different facets of this need. Datadog leads for infrastructure and application performance monitoring; ServiceNow leads for ITSM workflow analytics.
HR Teams
HR performance analytics requires deep HRIS integration and sensitivity around employee data. Workday Prism, Visier, and Lattice lead in this space. Visier is particularly strong for workforce planning and people analytics at scale.
Healthcare Organizations
Healthcare performance analytics requires HIPAA compliance, clinical data integration, and specialty metrics (readmission rates, patient satisfaction, length of stay). Epic has embedded analytics for health systems on its EHR software. Health Catalyst is a purpose-built healthcare analytics platform. Tableau is widely deployed in healthcare for operational and financial analytics, where clinical data integration is handled separately.
How to Choose the Right Performance Analytics Software
Selecting the wrong platform is expensive in multiple dimensions: the direct cost of licenses, the opportunity cost of delayed analytical capability, and the organizational disruption of migration. Use this decision framework to evaluate systematically.
Step 1: Define your primary use case. Are you primarily building operational performance visibility, strategic executive dashboards, product analytics, or ITSM analytics? Your primary use case should eliminate a large portion of the vendor landscape immediately.
Step 2: Assess your data maturity. If you have a mature data warehouse with clean, well-modeled data, you can use virtually any visualization layer. If your data is fragmented and inconsistent, you need a platform with strong data integration and transformation capabilities or you need to invest in your data infrastructure before selecting an analytics platform.
Step 3: Evaluate your internal technical resources. Platforms like Looker require dedicated data engineering support. Platforms like Domo are designed for business users without technical support. Match the platform’s technical requirements to your available resources.
Step 4: Map integration requirements. List the five to ten systems that contain your most important performance data. Evaluate each vendor’s native connectors, API quality, and data refresh frequency for those specific systems.
Step 5: Calculate total cost of ownership. License cost is typically the smallest component of TCO. Include implementation services, internal resource time, training, ongoing administration, and the cost of potential migration.
Step 6: Conduct a structured proof of concept. Do not select a platform based solely on a vendor demo. Run a 30-day POC against a real use case with real data, evaluated by the actual users who will use the platform daily.
Step 7: Assess vendor trajectory. The performance analytics market is consolidating and evolving rapidly. Evaluate each vendor’s investment in AI and machine learning capabilities, their financial stability, and their product roadmap alignment with your needs over a three-to-five-year horizon.
Common Mistakes Companies Make with Performance Analytics
Measuring activity instead of outcomes: Tracking the number of sales calls made tells you about activity; tracking the pipeline generated per call tells you about performance. Organizations that measure inputs rather than outcomes create the illusion of accountability without the substance.
Building dashboards nobody uses: A dashboard that gets checked once during its launch week and then forgotten is not a performance analytics asset, it is a waste of engineering time. User adoption must be designed into the analytics program from the beginning through role-specific relevance, executive modeling, and integration into existing meeting rhythms.
Neglecting data quality: Sophisticated analytics applied to poor-quality data produces sophisticated misinformation. Data quality completeness, accuracy, timeliness, consistency must be treated as a prerequisite, not an afterthought.
Creating metric proliferation: More metrics are not better metrics. Organizations that track hundreds of KPIs create noise that drowns the signal. Ruthless prioritization of the metrics that actually predict strategic outcomes is a discipline, not a limitation.
Confusing correlation with causation: Performance analytics surfaces relationships in data; it does not automatically explain those relationships. Teams without analytical sophistication frequently draw causal conclusions from correlational data, leading to misguided interventions.
Skipping the governance layer: When different teams calculate the same metric differently, performance reviews become arguments about methodology rather than discussions about performance. A single source of truth requires governing who defines metrics, who owns them, and how discrepancies are resolved.
Treating analytics as a project rather than a program: Analytics capability requires ongoing investment in new data sources, refreshed metrics, updated models, and continuous user enablement. Organizations that treat it as a one-time implementation find their analytics capability degrading within 12 to 18 months.
Common Challenges and Solutions
| Challenge | Root Cause | Solution |
| Low dashboard adoption | Dashboards not relevant to users’ daily decisions | Co-design dashboards with end users; start with their top three questions |
| Data silos | Systems not integrated; political resistance to data sharing | Establish a data governance committee; invest in an integration layer |
| Metric disagreements | No single definition of metrics; multiple calculation methods | Create a metric catalog with locked definitions owned by business unit leaders |
| Slow time-to-insight | Manual report generation; batch data processing | Automate ETL pipelines; move to real-time or near-real-time data refresh |
| The analytics team as a bottleneck | All analytical requests are routed through the central team | Invest in self-serve analytics capability; train business users on basic analysis |
| Forecast inaccuracy | Models not updated; biased historical data; poor feature selection | Establish model review cadence; track and publish forecast accuracy metrics |
| ROI unclear | Analytics not connected to business outcomes | Define expected outcomes before implementation; track leading and lagging indicators of analytics ROI |
Future Trends in Performance Analytics
AI-native analytics: The next generation of performance analytics platforms will not require users to build dashboards or define metrics manually. AI systems will automatically surface the most important performance signals, explain deviations in natural language, and recommend interventions. The analyst role will shift from data preparation to insight validation and decision facilitation.
Composable analytics architectures: Rather than monolithic platforms, forward-thinking organizations are building composable analytics stacks of best-of-breed components for data ingestion, transformation, storage, semantic modeling, and visualization that can be assembled and reconfigured as needs evolve.
Augmented decision intelligence: Beyond surfacing insights, next-generation platforms will incorporate decision frameworks, organizational constraints, and risk parameters to recommend not just what is happening but specifically what the decision-maker should do and simulate the likely outcomes of alternative choices.
Performance analytics at the edge: As IoT devices proliferate in manufacturing, logistics, and healthcare, performance analytics will increasingly operate at the network edge processing data locally before it reaches a central data warehouse, enabling sub-second response to performance events in physical operations.
Federated analytics: Privacy regulations and data sovereignty requirements are driving interest in federated analytics architectures, where data remains in its original location and analytical computations are performed across distributed data sources without centralizing sensitive information.
Continuous performance management: The traditional performance review cycle annual, semiannual, or quarterly is giving way to continuous performance management systems that provide real-time feedback, rolling goal adjustment, and dynamic coaching recommendations based on performance data streams.
Natural language analytics: Platforms increasingly support natural language querying, asking analytics systems questions in plain English and receiving accurate, contextualized answers. This democratizes analytical access beyond data-literate users and enables performance analytics to reach every level of the organization.
Expert Recommendations for Building a Winning Analytics Strategy
Drawing from deployment experience across hundreds of organizations and the academic and practitioner literature on organizational performance, these principles distinguish high-performing analytics organizations from the average.
Start with the decision, not the data. Before collecting a single data point, ask: what decision will this data improve? Analytics initiatives that begin with data collection and then search for applications rarely produce business value. Analytics initiatives that begin with high-value decisions and work backward to the data they require almost always do.
Build for the skeptic, not the enthusiast. Every organization has early adopters who will embrace analytics regardless of quality. The measure of analytics success is whether the skeptics, the experienced managers who trust their instincts over data, come to rely on the system. Build for them.
Invest in the semantic layer. The semantic layer, the shared definitions of metrics, dimensions, and business logic that sit between raw data and user-facing analytics is the most underloved component of an analytics architecture. Organizations that invest in it create a single source of truth that eliminates the metric disagreements that derail performance reviews. Organizations that skip it spend years arguing about numbers instead of acting on them.
Make performance visible without making it weaponized. Transparency in performance data is powerful, but if people believe that data will be used punitively rather than developmentally, they will game the metrics, hide the problems, and undermine the analytics program. Create norms and governance that make performance data a tool for support, not surveillance.
Measure the analytics capability itself. Treat your analytics program as a product with its own performance metrics: platform adoption rates, analyst-to-business-user ratio, time-from-question-to-insight, forecast accuracy, and business decisions influenced by analytics. These metrics tell you whether your investment is generating returns and where to invest next.
Prioritize data literacy at every level. The most sophisticated analytics infrastructure produces no value if the people interpreting its outputs cannot distinguish a statistically significant trend from random variation, or a correlation from a cause. Invest in data literacy training across the organization not just for analysts, but for the managers and executives who will make decisions based on the insights.
Final Thoughts
Performance analytics is not a technology investment. It is a strategic capability that, when built correctly, becomes a durable competitive advantage that compounds over time.
Organizations that lead in performance analytics share several characteristics: they treat measurement as a discipline, not a project; they invest in data quality and governance as seriously as they invest in dashboards; they connect every metric to a decision and every decision to an outcome; and they continuously raise the sophistication of their analytical capability, moving from descriptive to diagnostic to predictive to prescriptive.
The gap between organizations at the frontier of performance analytics and those still operating on instinct and lagging indicators is widening. The cost of building this capability has never been lower. The cost of not building it has never been higher.
The organizations that will win in 2026 and beyond are those that can see their performance clearly, understand it deeply, predict it accurately, and act on it faster than their competitors. That is what performance analytics enables. And that is why, for serious organizations in competitive markets, it is no longer optional.
FAQs
Q: What industries benefit most from performance analytics?
Performance analytics delivers value across all industries, but organizations with complex operations, large workforces, or data-rich customer interactions SaaS, financial services, healthcare, retail, manufacturing, and professional services tend to realize the largest returns.
Q: Is performance analytics the same as data analytics?
No. Data analytics is a broad discipline that includes any form of data analysis. Performance analytics is a specific application of data analytics, explicitly connected to measuring and improving goal achievement. All performance analytics involves data analytics; not all data analytics is performance analytics.
Q: What data does performance analytics require?
The data requirements depend on what you are measuring. Sales performance analytics requires CRM data. HR performance analytics requires HRIS data. Financial performance analytics requires ERP data. Most enterprise performance analytics programs integrate data from five to fifteen source systems.
Q: How do you measure the ROI of a performance analytics investment?
ROI is measured by comparing the business outcomes achieved (faster decisions, reduced churn, improved forecast accuracy, cost reduction) to the total cost of the analytics program (software, implementation, internal resources). Organizations typically see ROI within 12 to 18 months of a well-executed implementation.
Q: What is a performance analytics dashboard?
A performance analytics dashboard is a visual interface that displays real-time or near-real-time performance metrics against defined goals, typically with trend indicators, alerting, and drill-down capability for root cause investigation. Dashboards are role-specific and designed to surface the most decision-relevant information for a specific audience.
Q: How does performance analytics support strategic planning?
Performance analytics provides the evidence base for strategic planning by surfacing historical performance trends, identifying the drivers of past outcomes, and generating predictive models for future scenarios. It enables strategy teams to test assumptions with data, model the impact of strategic choices, and monitor strategic initiative performance in real time after launch.
This article is intended as a comprehensive strategic resource on performance analytics for business leaders, technology decision-makers, and data practitioners. It reflects current best practices and platform capabilities as of 2026.